
Last Friday’s trading action generated an almost 2.5% drop in the S&P 500 (SPX), and drops of that magnitude requires further evaluation. As it stands currently, there are clusters of TDST Support between 2089.39 to 2097.90. A break below those lines of support should validate a bear trend at least on the daily SPX. To see how this might happen, timeframe continuation will provide the best guidance. We’ll start with the 4 hour SPX, then the daily, and finish with the weekly. Details are below:
S&P 500 (SPX) SHORT TERM OUTLOOK: BEARISH
Neutral if SPX closes above 2149.72 mid day or 2128.21 end of day on Tuesday, September 13, 2016.
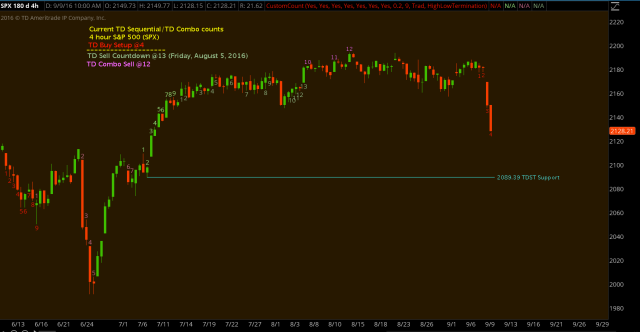 In addition to the levels above, if the current 4 hour TD Buy Setup cannot close below the 2089.39 TDST Support level before recording TD Buy Setup @9, then a counter trend reversal is in the cards.
S&P 500 (SPX) SHORT/INTERMEDIATE TERM OUTLOOK: NEUTRAL
Bearish if SPX closes below 2097.90 on Monday, September 6, 2016.
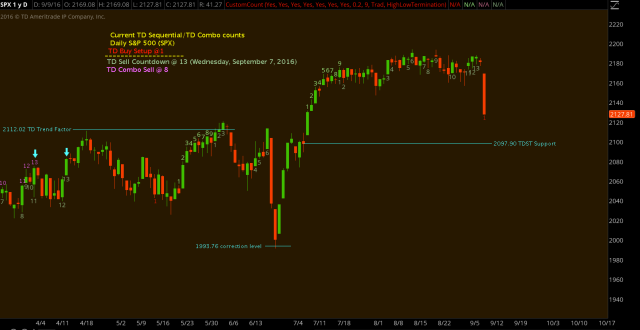 The TDST Support at 2097.90 holds the most weight of all the timeframes. Basically any close below that level serves as a warning going forward.
S&P 500 (SPX) INTERMEDIATE/LONG TERM OUTLOOK: NEUTRAL
Bearish if SPX closes below 2096.96 on Friday, September 16, 2016.
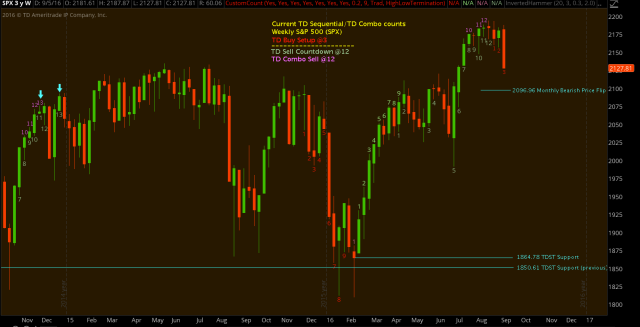 Although we are still open for a 13 count TD Sell Countdown or TD Combo Sell, the major concern is if the weekly SPX closes below 2096.96, the monthly bearish price flip. Achieve that, and it will become apparent volatility will continue to persist.
S&P 500 (SPX) LONG TERM OUTLOOK: BULLISH
Neutral if monthly SPX closes below 2096.96 on Friday, September 30, 2016.

I watched Tuesday’s market close carefully. The SPX bounced back and forth across the 2128.21 mark at least 10 times in the last 5 minutes finally closing below.
Bears can only muster 1 or 2 days of selling before stepping away.
Triple Witch Friday and S+P 500 realignment on Friday. Huge volume day coming. Means up to me.