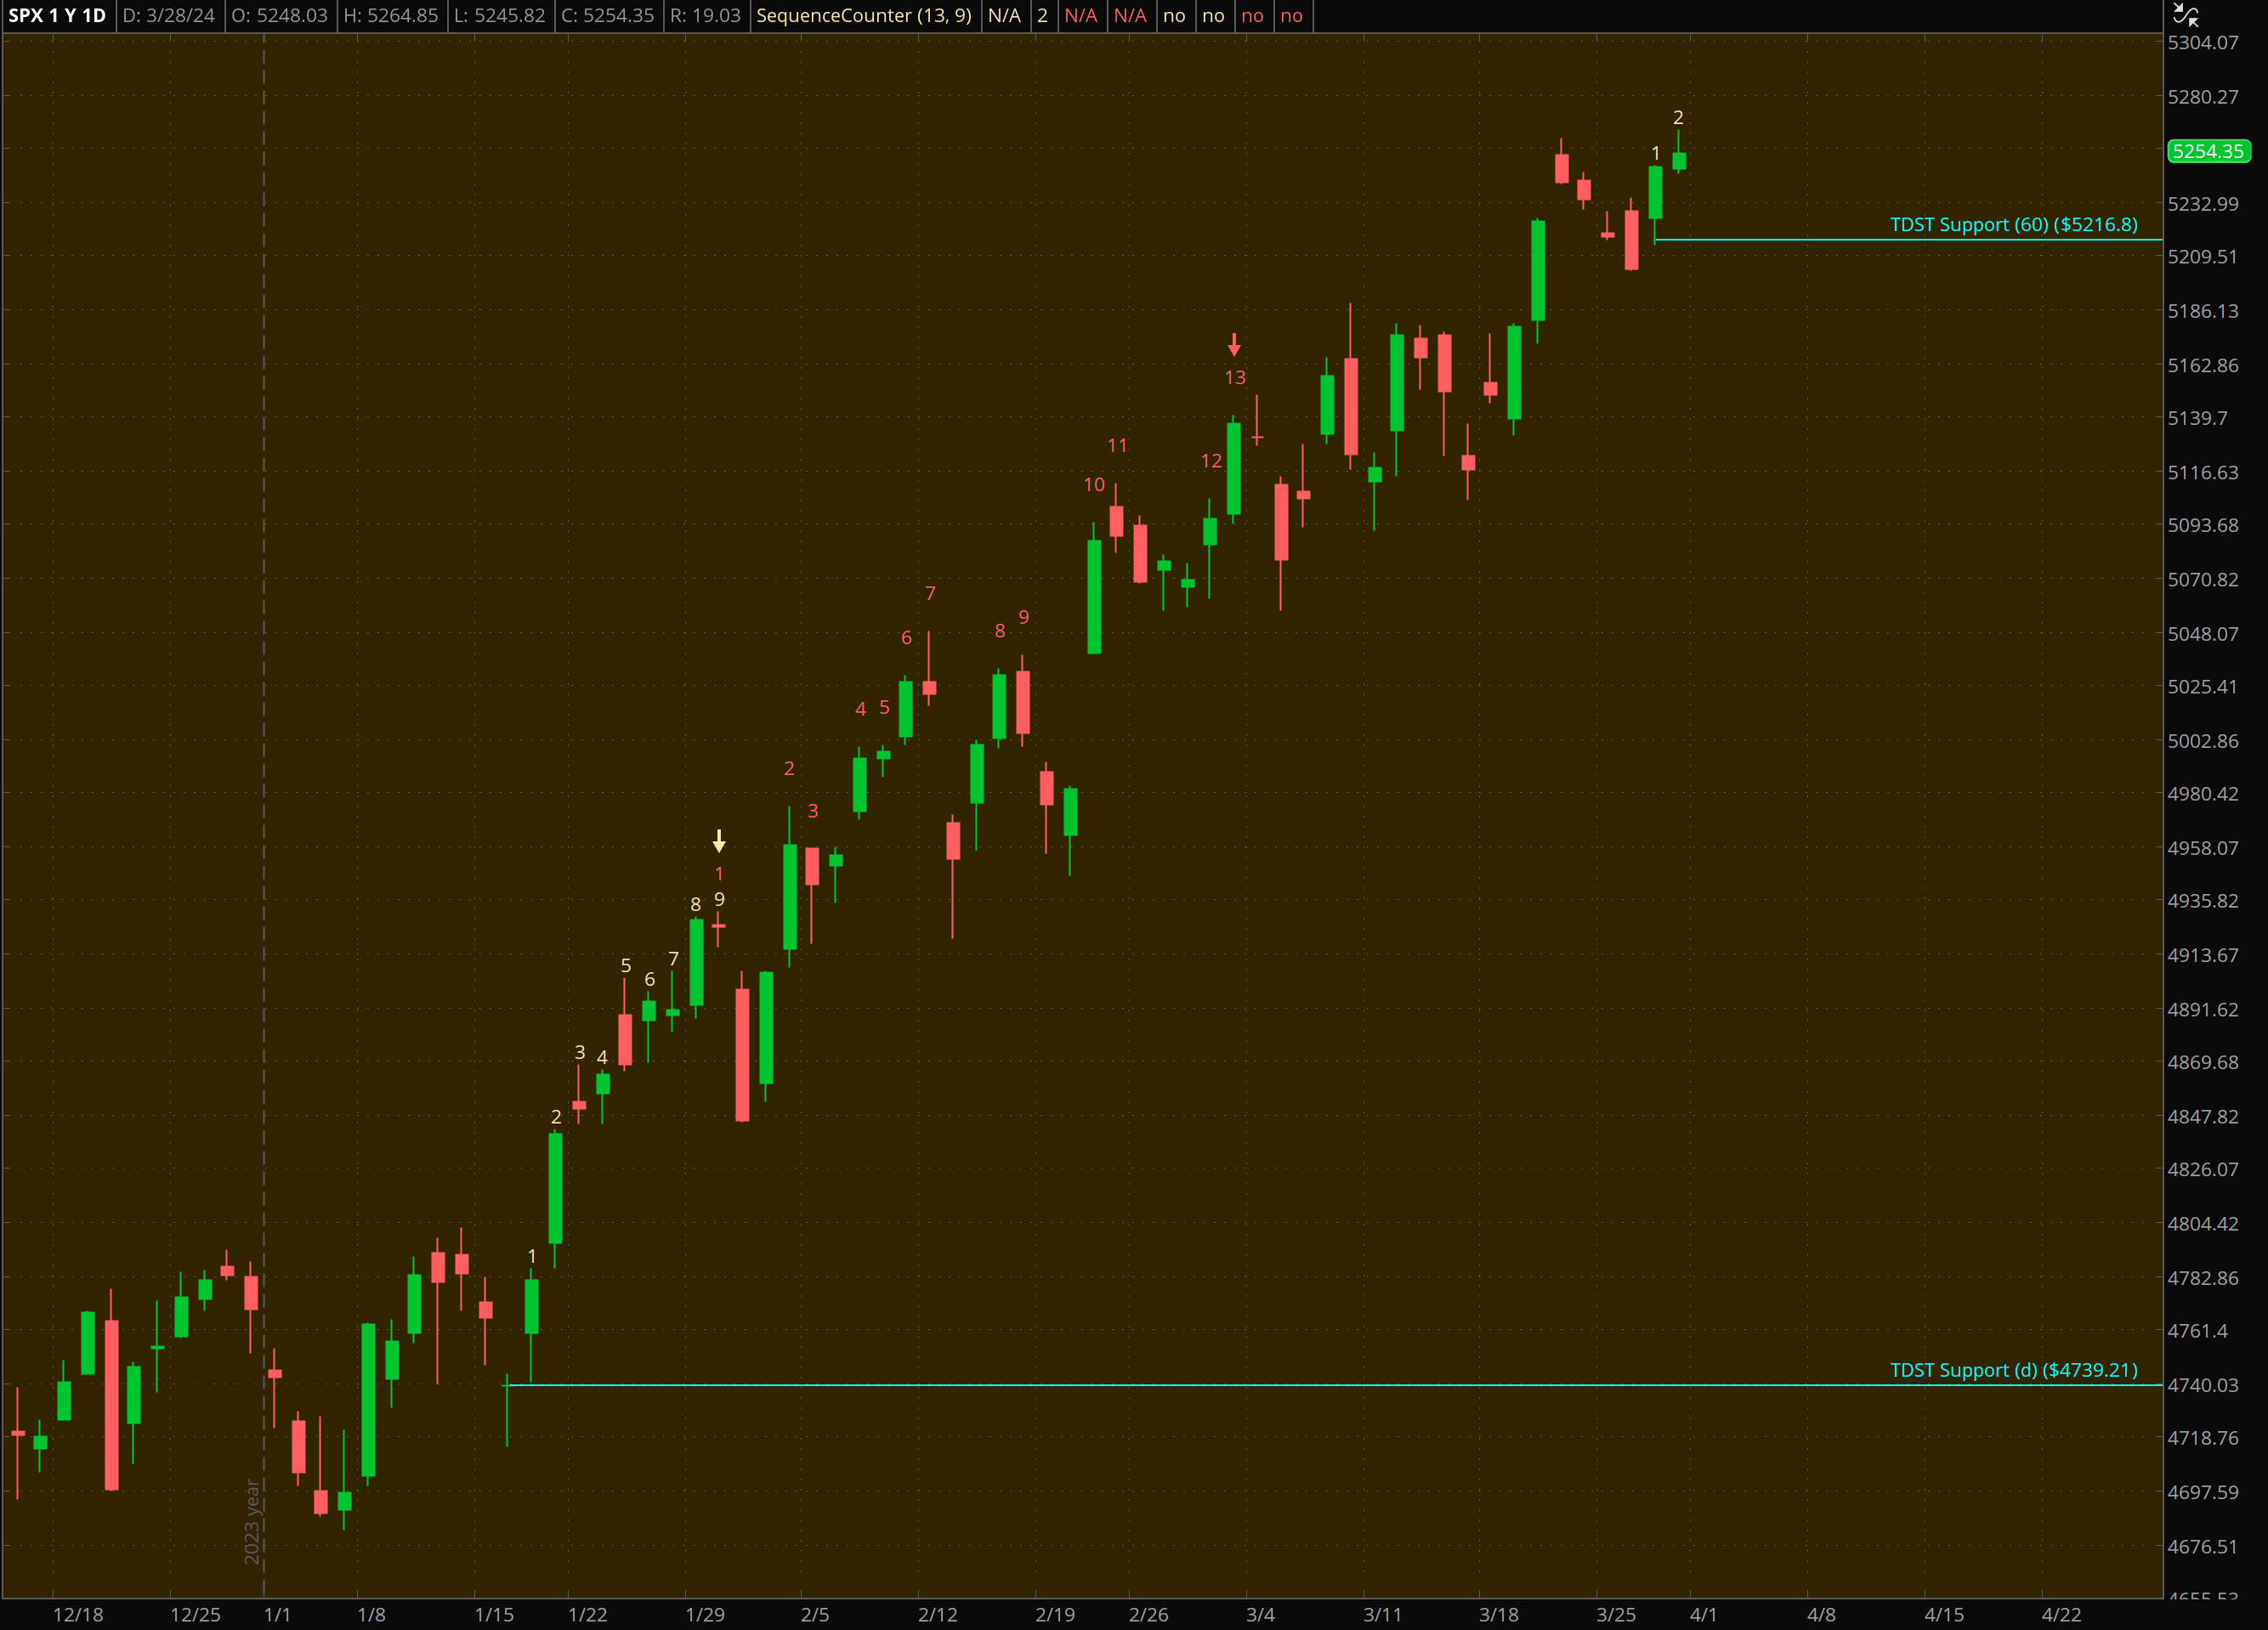
Wednesday’s May 15th CPI release will be the primary catalyst for markets as the FOMC has placed a large weight on inflation’s direction. The daily S&P 500 (SPX) has an active TD Sell Setup @6. This places a 9 count right on the day of the CPI release.
There are subtleties surrounding the price action on that day, and not just simply fading the 9 count. The easiest trade is if the CPI comes in hot. With the SPX at price exhaustion levels, a selloff to eventually test the lows made last April is probable.
If the CPI comes in line to expectations, fading an initial pop would make sense. If the SPX closes below 5177.11, the TDST Support for the 30 and 60 minute timeframe, that would signal the market is ready for the next phase of the downturn. Hold 5177.11, new highs above 5264.85 are in sight.
If the CPI comes in much cooler than expected, then it gets trickier. New highs should be made and a continuation of TD Sell Setup running concurrently with TD Sell Countdown. But also watch for a minor consolidation just based on the SPX at price exhaustion levels before resuming the bullish trend. Though not the base case, be wary of an intraday reversal.

Above is a great guide from JP Morgan to navigate expectations on the SPX’s reaction to the CPI release. ( Note the previous posted JP Morgan CPI chart was incorrect. Reposting the correct one – May 14, 2024)